#3: Visualize your code in KDevelop
Hello planet,
Yes, after a hard journey through free software conferences including International Forum on Free Software (FISL) and Gran Canaria Desktop Summit, I'm happy to bring you fresh news about my GSoC project in KDevelop.
As I've previously mentioned, not rarely we face the hard task of understanding complex interactions between software modules as a pre-requisite for evolution/maintenance activities. Software Visualization (or Program Comprehension) tools have become a popular and indispensable feature in modern IDEs, mainly when integrated with conventional tools such as code editor, debugger, revision control, and profilers.
In my last post, I've presented how control flow graphs between method invocations can be easily created in KDevelop:
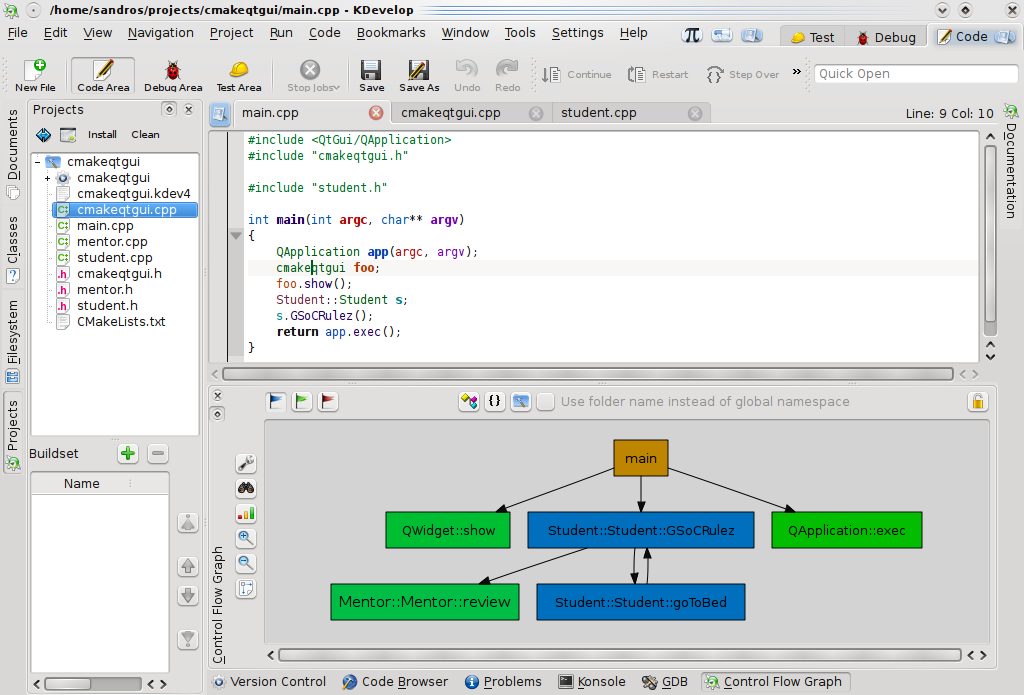
In more complex systems this can lead to not so useful graphs due to the high ammount of control flow. By showing control flow in a coarse-grained way the developer can be able to visualize interactions between classes:
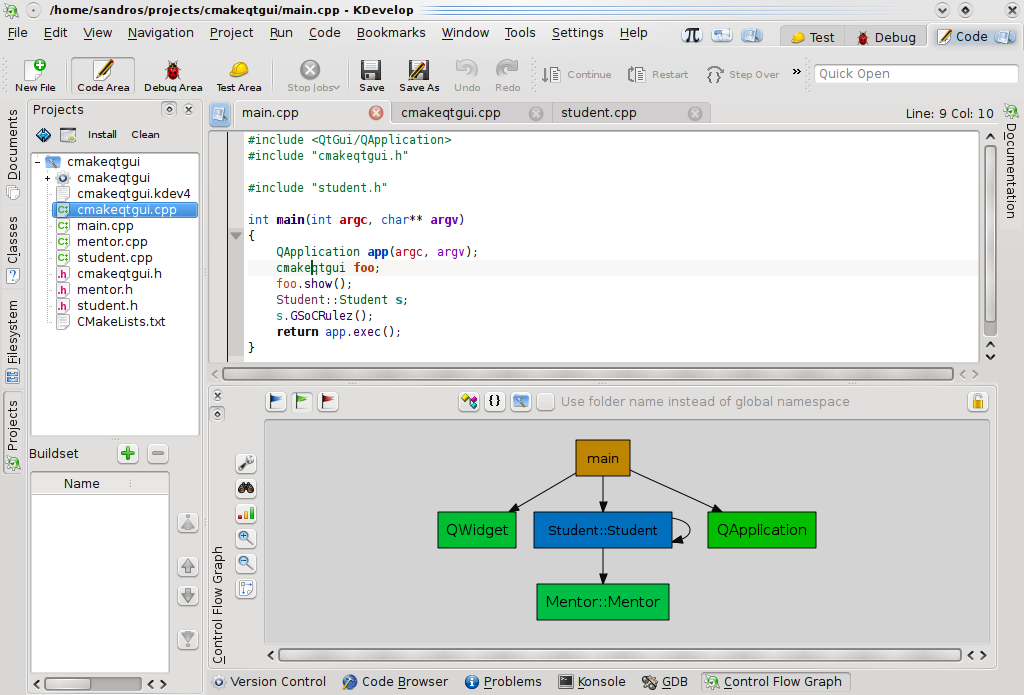
... or even between namespaces:
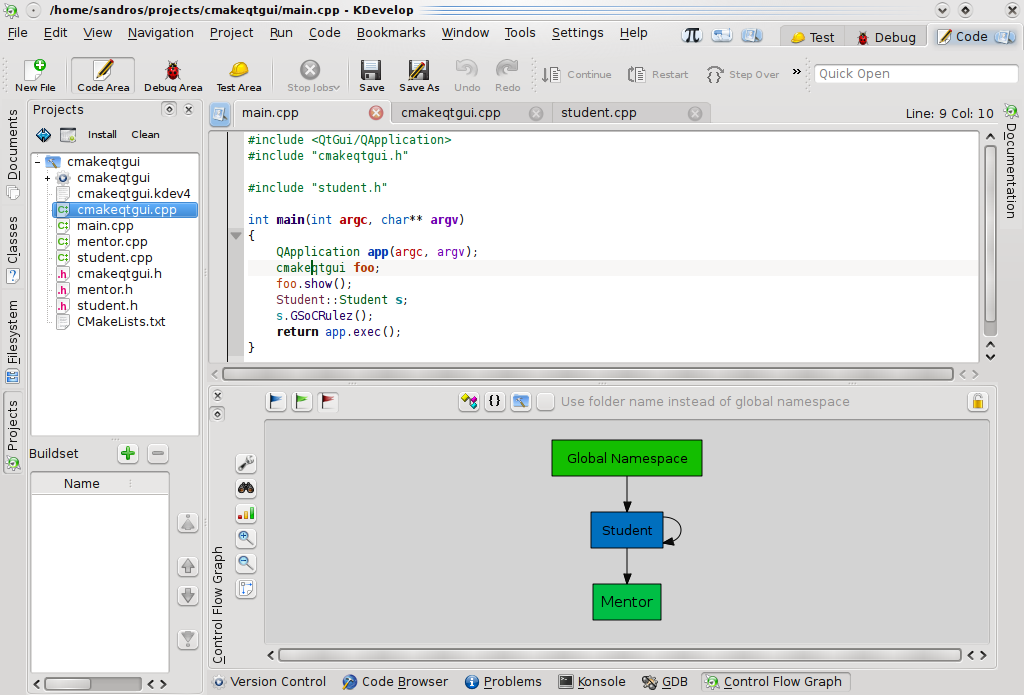
Regardless of the used control flow mode (methods, classes, or namespaces) fully two-way integration between code editor and control flow graph is already provided. By clicking on a given node code editor is automatically redirected to the method/class/namespace definition (or declaration, in case of external libraries without available .cpp files). This default behaviour can easily be modified by locking the graph while navigating by clicking its nodes.
Ok, so far we have been using a single graph layout algorithm and colouring graph nodes according to their immediate named scope (I mean, class name when visualizing control flow between methods and namespace name when visualizing control flow between classes).
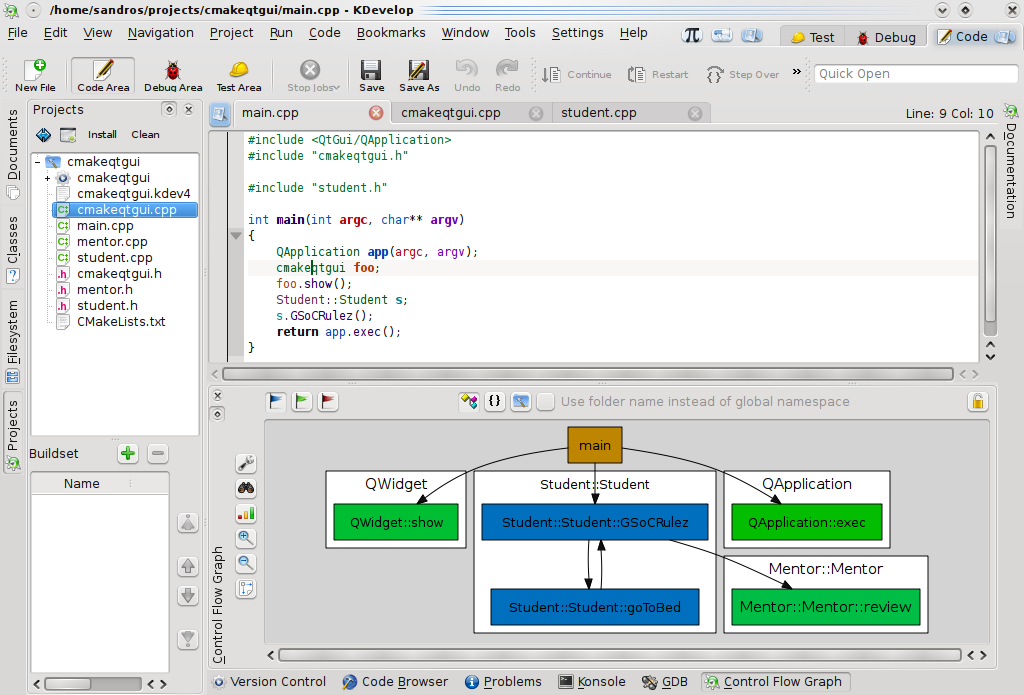
What about clustering nodes by their immediate scope ? The following clustering modes are already working:
- Clustering by class: methods belonging to the same class are grouped together and interactions arcs are drawn to other class clusters:
- Clustering by namespace: in a similar way, classes can be grouped by their namespace (including Global Namespace):
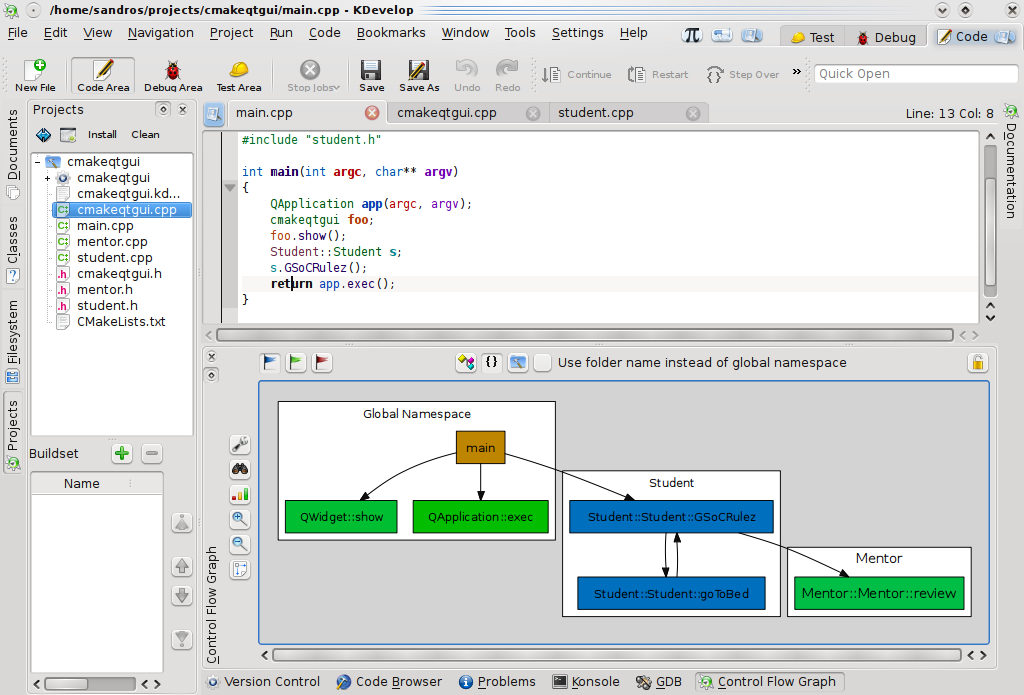
- Clustering by project: adhering to KDevelop 4 support for multiple working projects, nodes can also be grouped by project name. This certainly is a quite useful mechanism for understanding system boundaries and its relationships with external libraries and other projects:
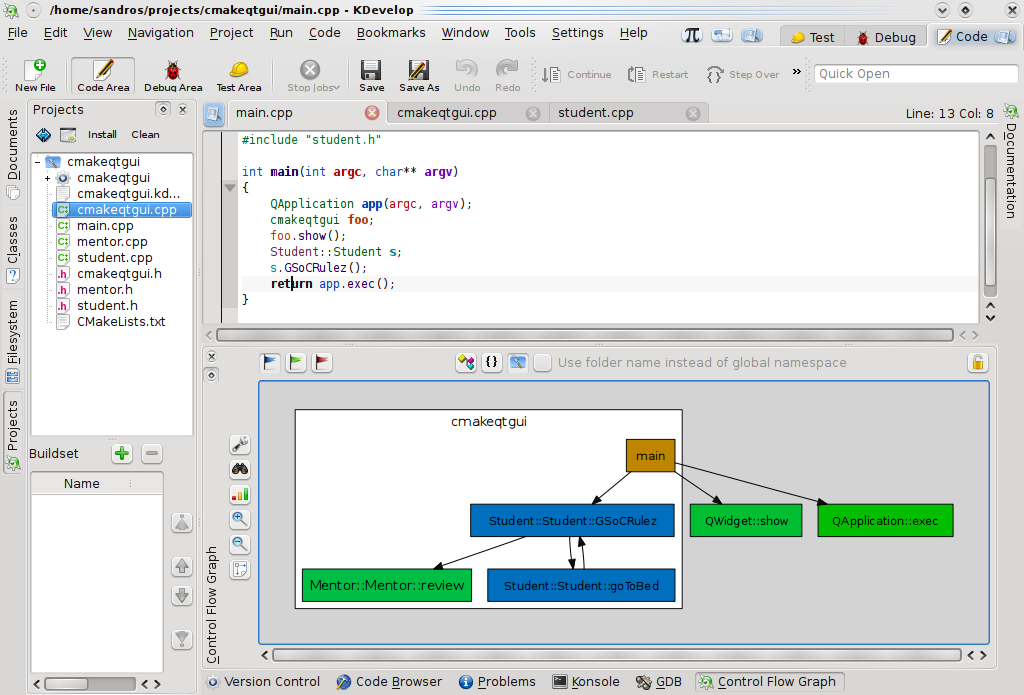
Control flow mode and clustering mode were designed as orthogonal mechanisms so that (almost-)any (excluding some meaningless) combination can be achieved: control flow between methods clustered by namespace, control flow between classes clustered by project and so on.
Whilst control flow mode is actually a mutually excluding behaviour, clustering modes can be combined to provide a complete structured representation of control flow in the system.
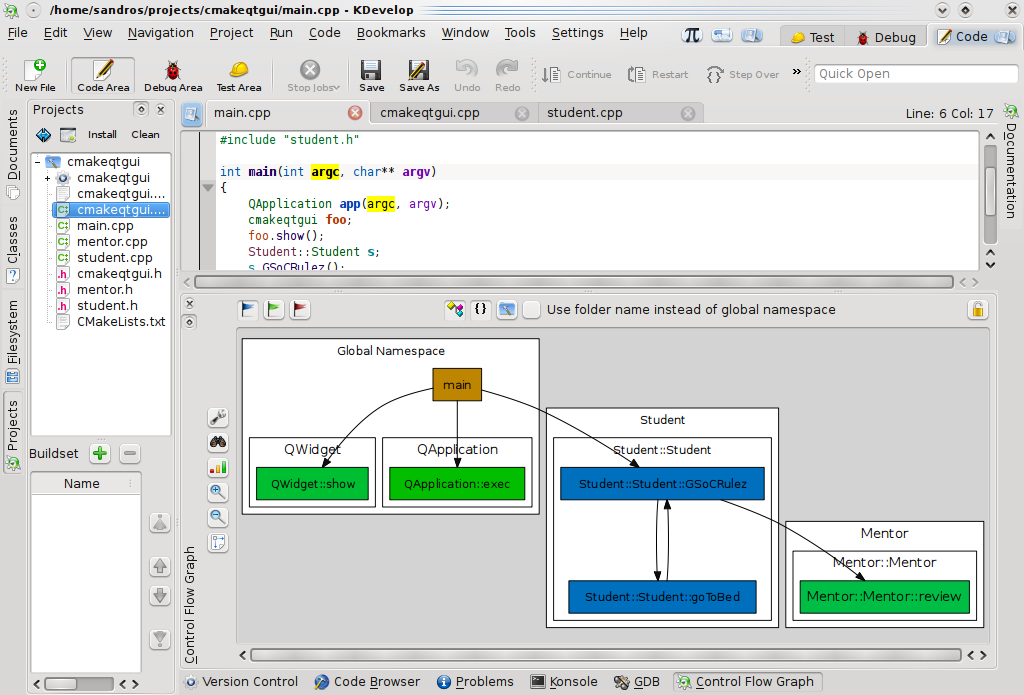
Maybe some developer would be interesting in clustering by class and namespace names:
... or even by all the available containers:
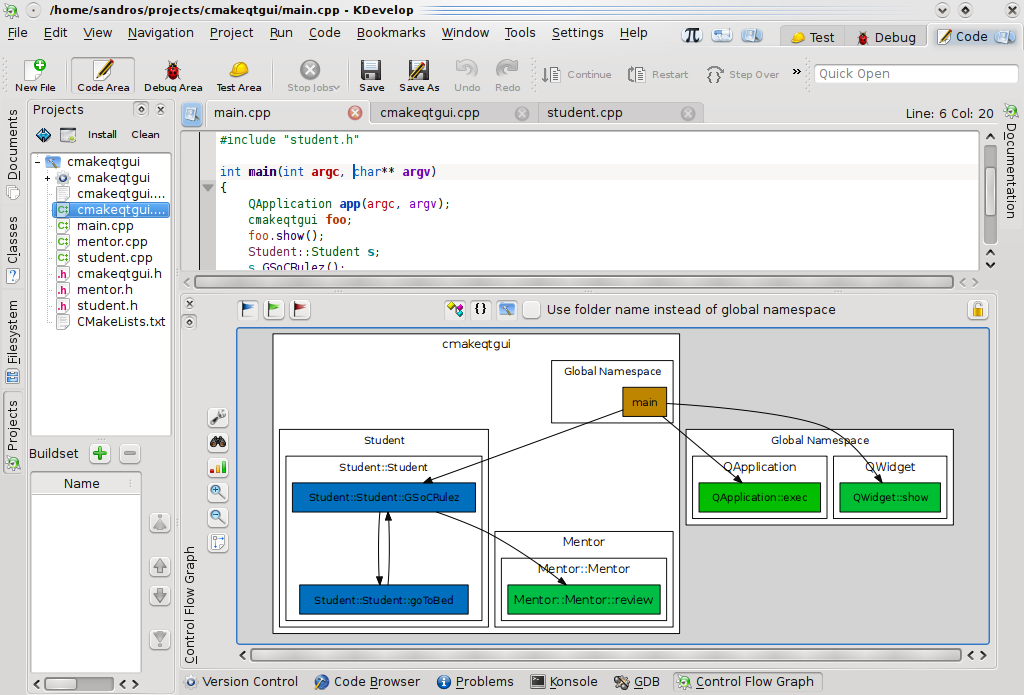
At this point, fellow hackers, how does our beloved visualization plugin look like ? :)
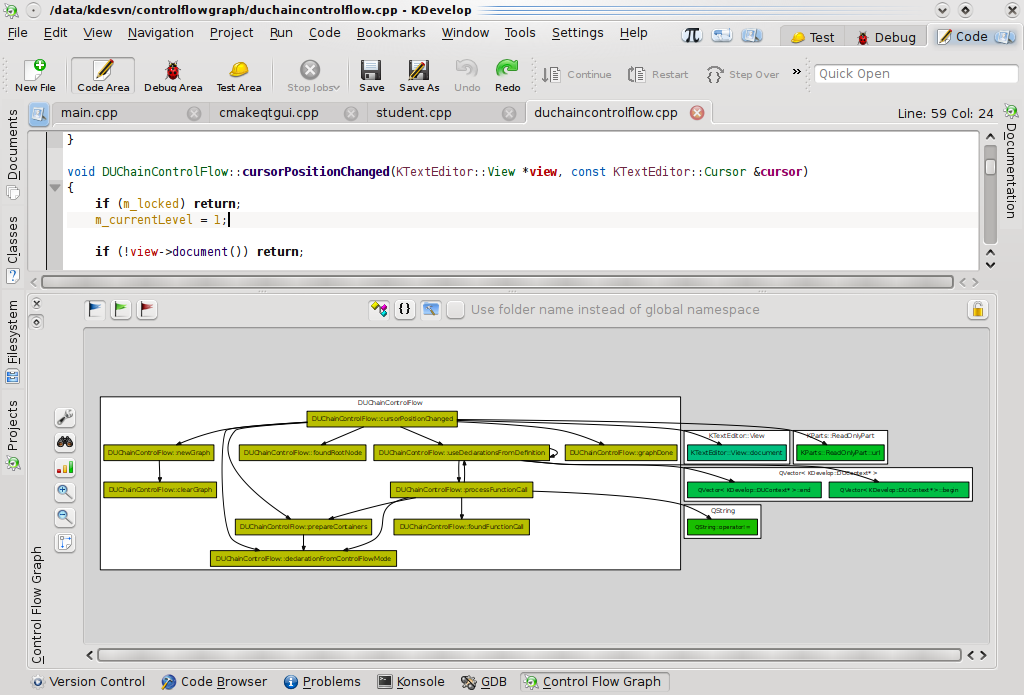
As for the future work, the following features are currently being evaluated:
- Drawing of incoming arcs: graphs are currently generated from the method containing the cursor and only outcoming arcs are represented. Drawing incoming arcs representing which entities use a given node is a quite important feature;
- Showing of uses related to a given arc: an arc (or edge) in a control flow graph is generated from one (or possibly many) invocation. Visualizing the invocations that produced that arc can also be a useful feature for software comprehension;
- Exporting features: currently all control flow graphs can be exported as png images. Using alternative formats as SVG would leverage the afterwards analysis of source code structure;
- Polymetric visualization: as I've promised as a second visualization paradigm in KDevelop 4.
Well, that's all folks ! Comments are welcome as usual.
See you in the next GSoC update :)

