#2: Visualize your code in KDevelop
Hey folks, a quick update because something pushes me to my bed :)
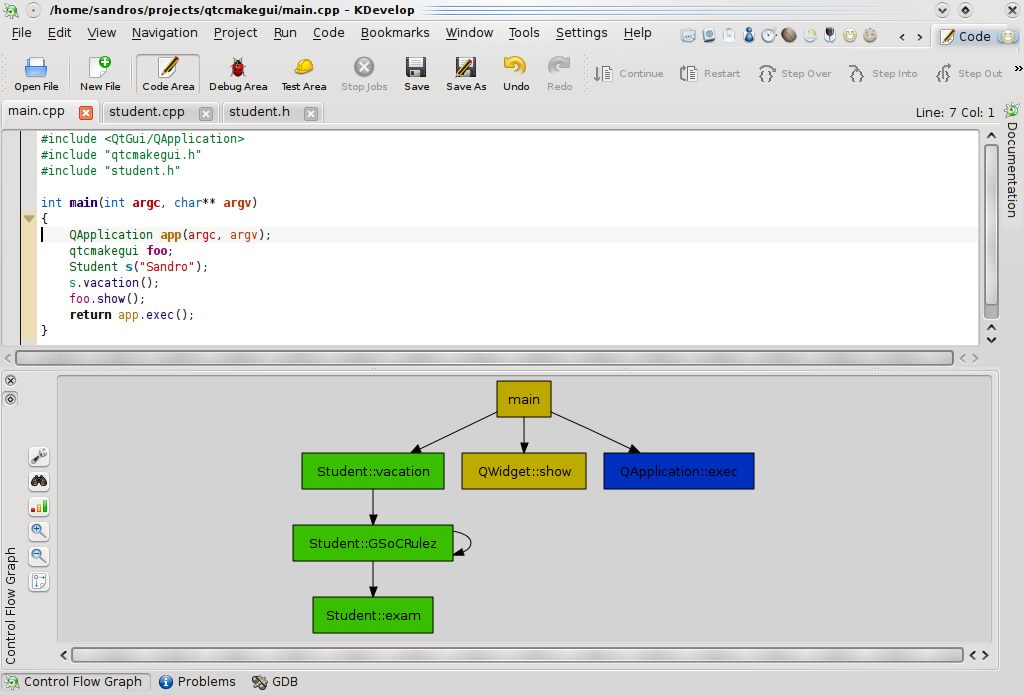
After a nice weekend we have a useful integration between KDevelop code editor and control flow graph plugin. You can easily get your graph updated when switching between functions in a class or between different opened classes. With such a mechanism, the developer is able to get an always-updated view of source code and experience the benefit of a unified use of code editor + code visualization.
What about, in a close future, something like a "coupling-meter" or "cohesion-meter" (há :)), which indicates if the developer is going into a modular and maintainable implementation "direction" ?
By now, the just implemented features are: fully code editor / control flow graph integration, support for recursive functions, multi-level support.
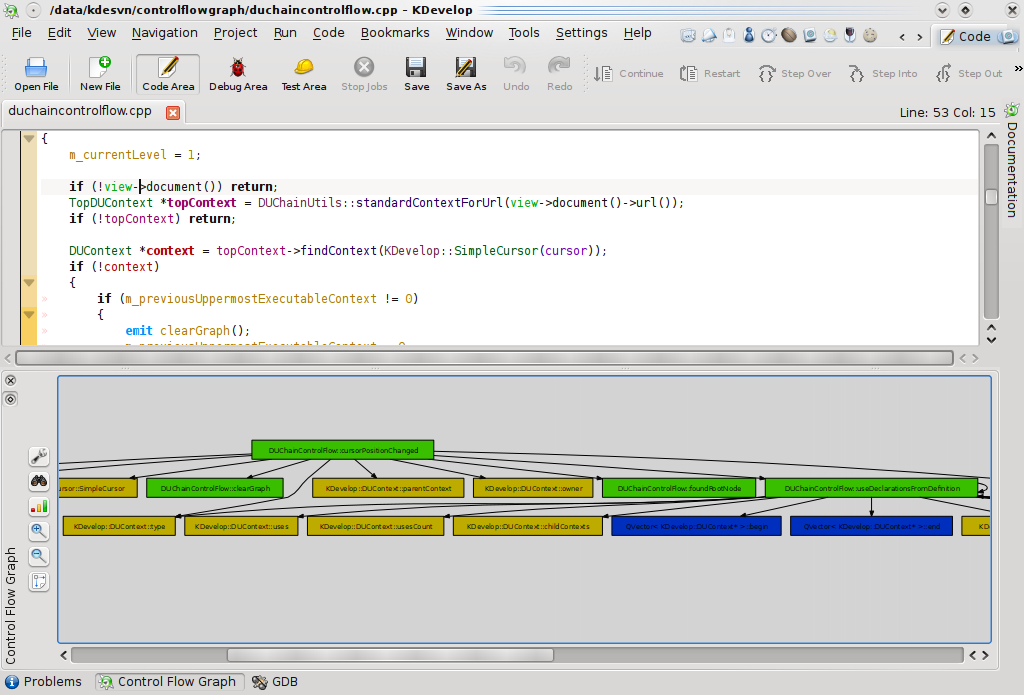
Here the plugin itself being visualized in KDevelop (max depth = 8):
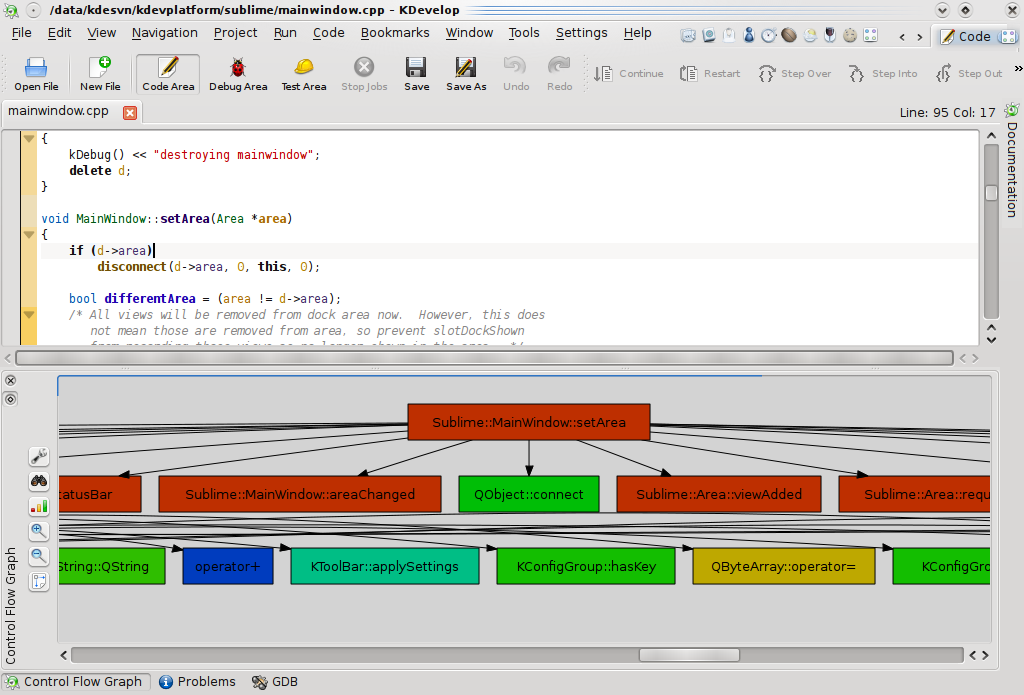
As asked by David Nolden, now we are able to understand the design of new KDevelop 4 UI (Sublime) :) (max depth = 8):
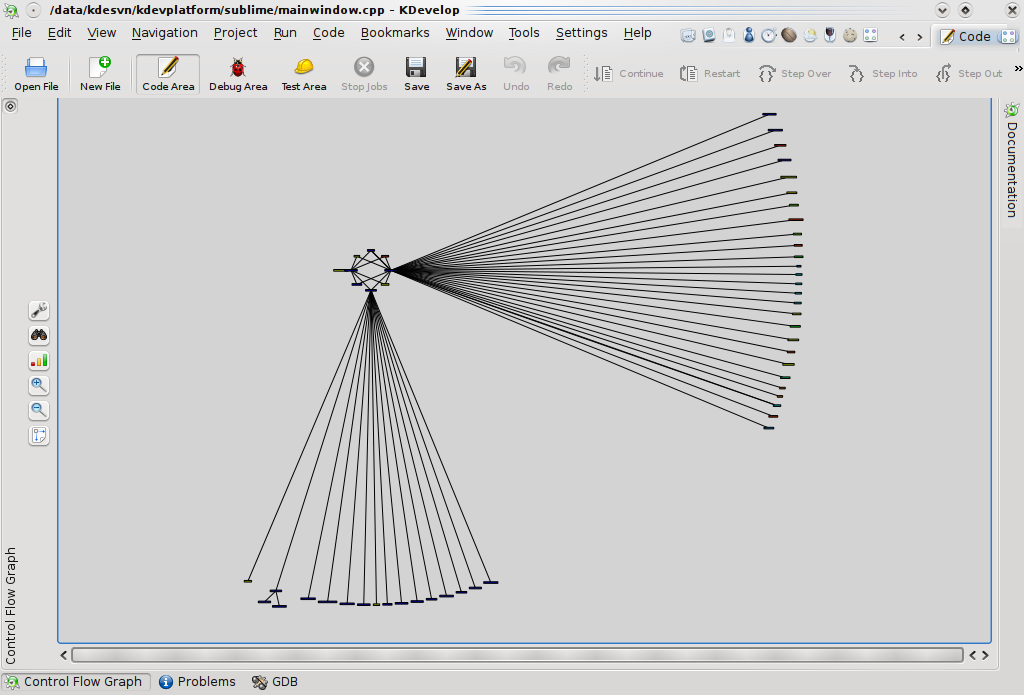
Sublime visualization in a "circo" layout:
In the following days I will enhance the navigation and filtering facilities, so that the developers could be able to refine their search to acquire just the desired information.
Keep connected, I promise a pretty video in the next GSoC update !
See you,
