GSoC: what does your code look like ?
Hi everyone,
I'm really very glad to join the KDE/KDevelop community as a GSoCer. My proposal relates to implementing visual paradigms for software comprehension in KDevelop, so I'll briefly describe the intended goals.
Abstract: This project aims to implement better approaches for program comprehension and developer interaction with software artefacts in KDevelop by means of code visualization mechanisms. For that purpose, I will introduce features for control flow graphs and polymetric visualization, implemented as part of an extensible framework that will facilitate the future development of new visualization paradigms (treemaps, class/package dependency, dynamic, evolution etc).
Motivation / Goal: Software is inherently intangible and invisible. Information visualization and software visualization mechanisms contribute to better understand software concepts, structures, and functions by evoking mental images that convey information through the human visual system into the human brain, regarding technical and cognitive idiosyncrasies.
Understanding how software artefacts implement functionalities and collaborate with each other is quite an important prerequisite for software evolution activities. In large and complex systems, browsing source-code and reading rarely provided documentation usually do not facilitate the rapid comprehension of aspects such as static and dynamic behaviour, evolution, metrics and architectural concerns.
Software visualization approaches can be categorized into three distinctive groups: static visualization, dynamic visualization, and evolution visualization. Static visualization deals with static parts and relations of the system which can be visualized without running the program, like source-code, data structures, static call graphs, and system modules. Dynamic visualization shows the behaviour of a program for a given input and has successfully been used for algorithm animation, architecture visualization augmented with run time information, and visual debugging and testing. Evolution visualization depicts how software changes over the time usually based on metrics such as code age, number of bug fixes, structural change, and evolutionary coupling.
Figure 1 shows some commonly used visualization paradigms (from top to bottom / left to right): control flow graphs, polymetric, treemaps, hyperbolic trees, euclidean conetrees, and citylizer. Each particular visualization paradigm is properly recommended for analysing a specific data type (2D, 3D, hierarchical, etc) and provides different navigation functionalities.
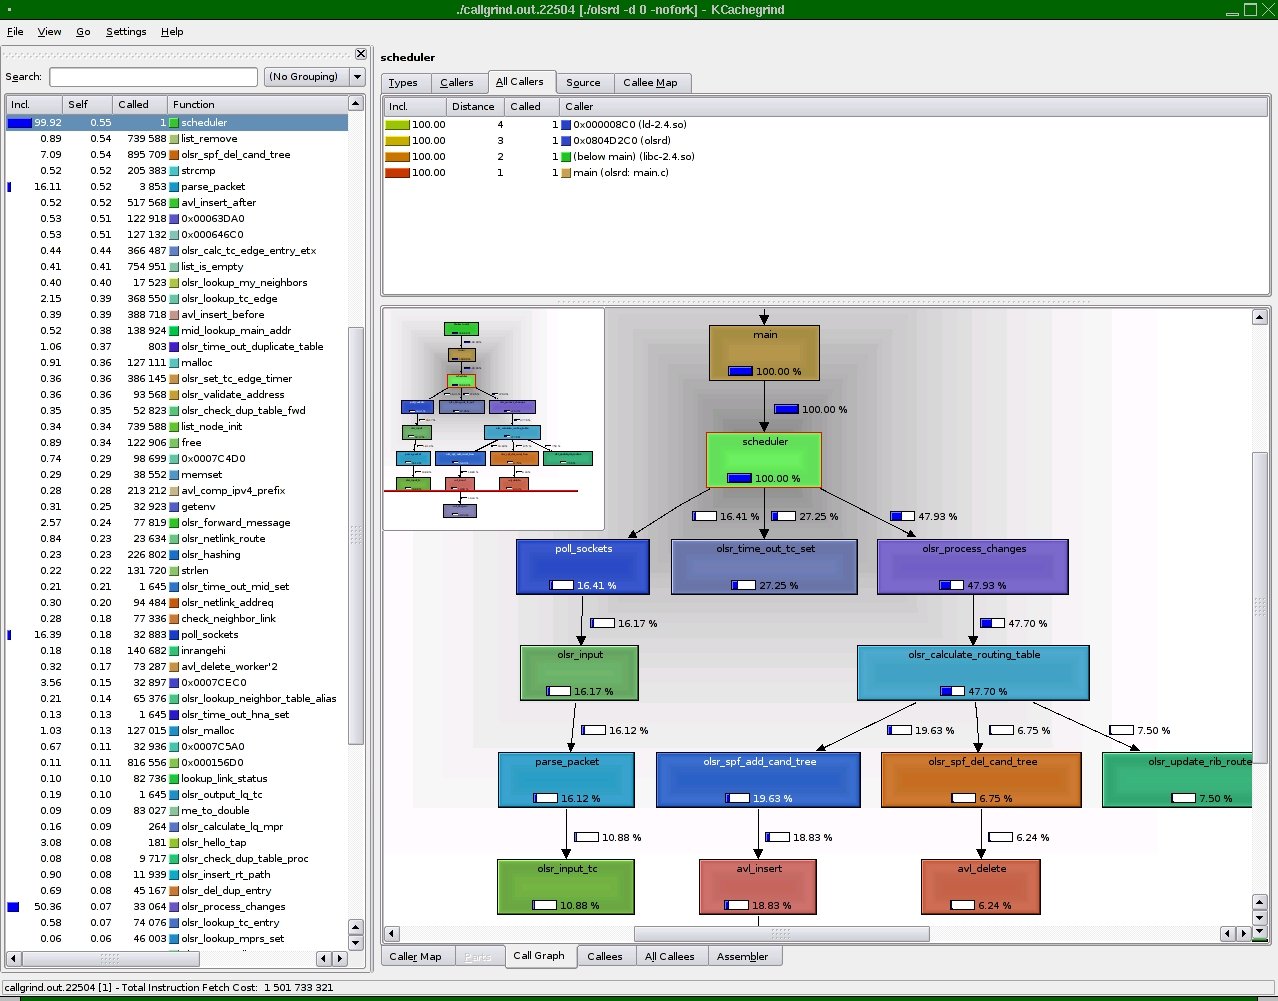 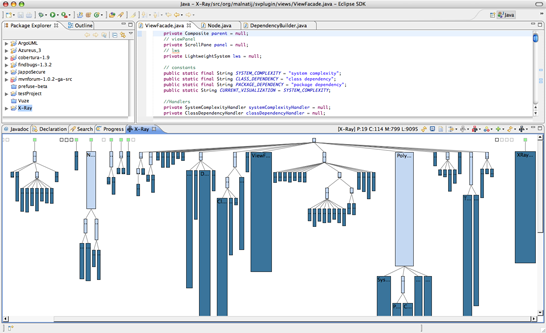 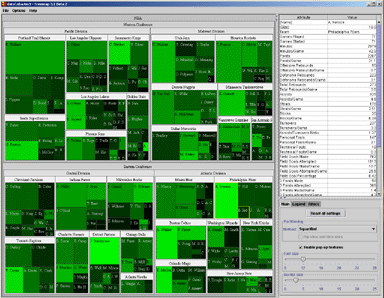 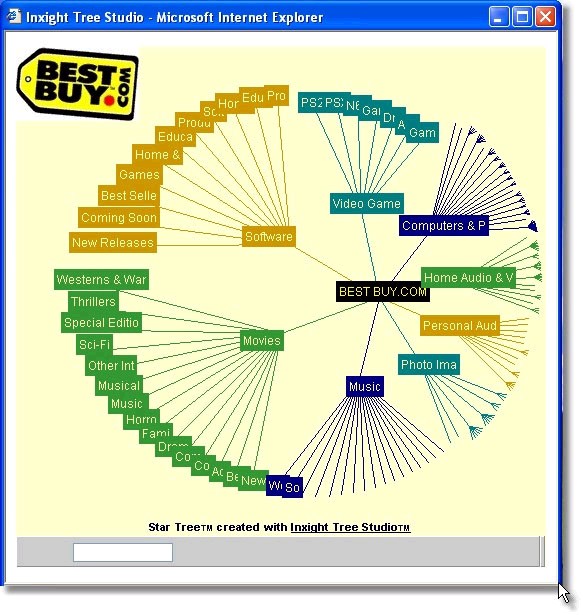 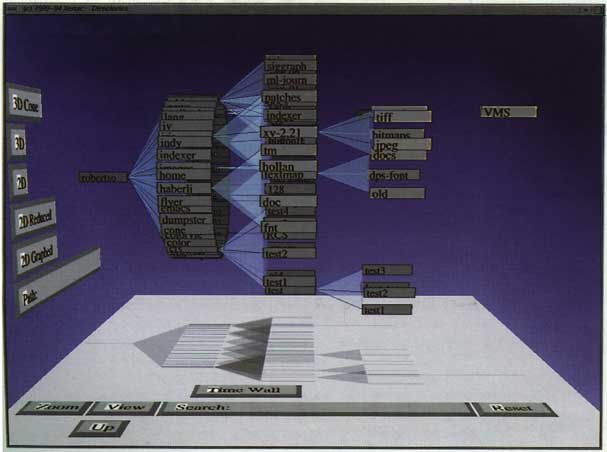 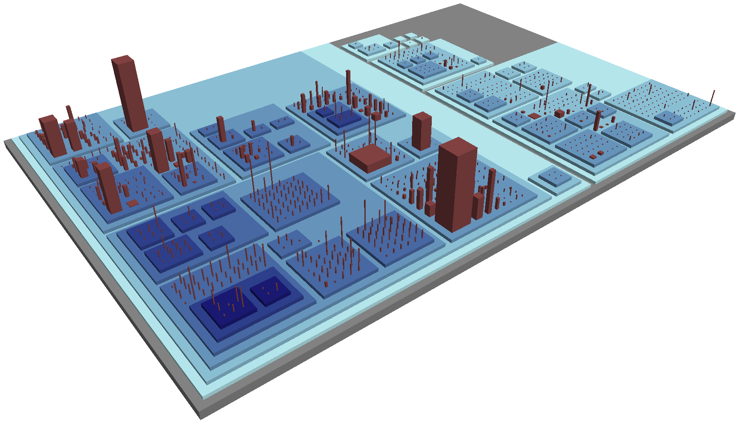
Figure 1: software visualization paradigms
My ultimate goal is to design and implement an initial support for software visualization in KDevelop. By the end of the project I expect to implement two paradigms for static visualization: control flow graphs and polymetric visualization. The expected implementation should be based on an extensible framework designed to set the stage for future implementation of new visual paradigms. In the next sections I present a brief description of control flow graphs and polymetric visualization.
Control Flow Graphs
Control flow graphs, and call graphs in particular, are directed graphs that describe calling relationships between computation modules in a system. Call graphs can be a record of an execution of the program (dynamic call graphs) or can represent every possible run of the program (static call graphs). Figure 2 depicts the call graph produced by the profiling tool KCachegrind.
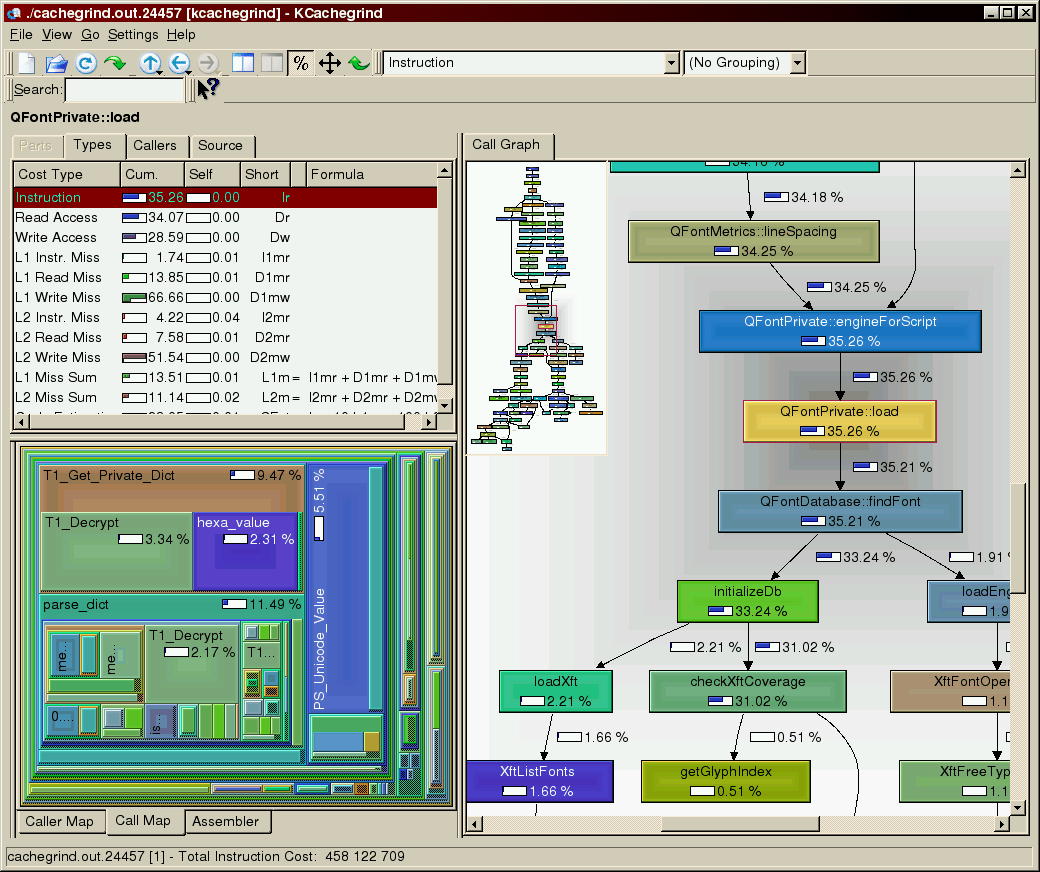
Figure 2: call graph visualization in KCachegrind
Call graphs have successfully been used for a range of purposes: human understanding of programs, data flow analysis, and detection of procedures that are never called, that represent recursive calls, and that implement infinite loops. Implementing call graphs generation and visualization tools requires the use of algorithms for source-code parsing, graph drawing layout, call graph navigation (pan, zoom, sub-branching) and call graph interaction (going to source-code from visualization and vice-versa).
Polymetric Visualization
The polymetric visualization paradigm has been successfully implemented in the Malnati’s X-Ray project and constitutes a major feature for metric-based program comprehension. In such approach class hierarchies are represented by connected rectangles and metrics extracted from source-code define the values of geometric parameters used in the visualization. Figure 3 shows a polymetric view where the width of the rectangle represents the number of methods implemented in that class, while the height of the rectangle represents the number of lines of code (LOC) of the whole class.
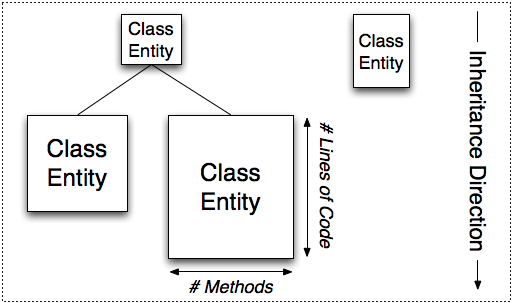
Figure 3: geometry-related metrics in the polymetric paradigm
A number of source-code metrics can be associated to different visual attributes like colour, shape or movement. For example, class age could be associated to rectangle’s colour representing recently modified classes in red and older ones in blue.
Such association to visual attributes improves software comprehension considerably: long and thin rectangles usually indicate classes with lower cohesion (high number of responsibilities), deep inheritance trees are usually an evidence of poor design raising issues like the fragile base class, recently modified classes representing unstable or untested code are easily identified etc.
Implementation Details: In KDevelop architecture, representation of source-code structure is achieved in a language-independent way by the use of the Definition-Use (DU) Chain. The expected visualization module should interact with DU Chain and keep a synchronized visual representation of code structure. The DU Chain implementation should be checked for the presence of the required information (number of methods and #LOC per class, class dependencies etc). Investigation will be performed into use of some higher level graph drawing libraries, such as QAnava, Qt/AI or Umbrello. Some interaction should be provided between the implemented visualizations and code browser, as well as basic navigation mechanisms (pan, zoom, sub-branching). The implementation should consider scalability issues when visualizing large scale projects.
Expected deliverables and success criteria: Required deliverables: extensible framework for software visualization, control flow graphs visualization, polymetric visualization, basic navigation functionalities.
Optional deliverables: configurable association of metrics to visual attributes, linking with the debugger and/or callgrind tools, another visualization paradigms.
Success criteria: code quality (modular and extensible framework), comprehensive documentation, stable implementation with scalability support for visualization of large systems, and timeliness.
I hope to have good news to announce soon !

